Every project comes with a built-in set of boundaries. Sometimes it’s budget, other times it’s the timeline, occasionally it’s the client, and the list goes on. Experience suggests that it’s almost always all of these.
In my last article, I discussed some of the technical and practical decisions that go into balancing features, budgets and timelines. For this article, I’m diving a little deeper into the decision-making process and how we should test our decisions to help our projects and clients stay on course.
Consider the case for creating print styles (if pint style are new to you, get up to speed with this article, this one or this one.). They are often overlooked, because native print features are also overlooked. By comparison, carousels (otherwise known as “sliders” or “stuff-everything-possible-on-the-home-page” boxes) typically get a great deal of attention from stakeholders, designers and developers. But just because our internal focus is different for these features, doesn’t mean one is more important or more effective in achieving a site’s goals. This is why it’s essential to track the right features and measure results. With data, rather than assumptions, we can invest our time in the features most important for a site and users.
Assumptions about “Interaction”
Often when planning a site and identifying features, decision makers have to weigh a combination of internal requests and their own preferences. There is a perception sometimes that making a page more “interactive” will make it more engaging and drive traffic.
The catch is that far too often, “interactive” is a request for more movement, piles of additional content or both. As a result, the site designer and builder have to invest time to not only get the extra information in front of users, but have it make sense and be functional.
What adds to the challenge is that during the effort to be more “interactive,” other valuable but comparatively simple features can get lost in the mix. Elements that users truly find valuable, even on a small scale, can be missed entirely. In short, the people paying for the site, designing the site, building the site, writing content for the site and marketing the site don’t always understand each others’ goals. And they may not understand the users’ goals either.
Thankfully we have web analytics. Whether you use Google Analytics or another tool, it’s pretty easy to see what pages are getting traffic, what links are being followed and, in general, what people are doing on your site. Armed with this information, you can make intelligent decisions about what works, what doesn’t, where to expend effort and where to reel it in.
The problem is that we aren’t always tracking the right things.
Print Styles
Print styles are, or at least should be, a fundamental part of responsive design. Just as we use media queries to target differently-sized (or oriented) displays and alternate devices, targeting the printed page is a natural part of this. Print has been supported as a media type since well before responsive design, and users still print pages for everything from real-world document sharing to conference schedules when internet access is overloaded and spotty.
Despite the user value that print styles can bring to a site, decision makers often assume they aren’t a priority or even necessary. In fact, in all the time I have evangelized print styles, my arguments are often countered by people who claim that nobody prints web pages. This assumption is likely due to the fact that, on the whole, we don’t know when users actually print a page. We don’t measure it, we don’t see its use and, by extension, we assume it has no value.
And, despite all my observations to the contrary, anecdotal evidence isn’t good data. Without good data, how can I know if even my minimal amount of time developing print styles is worth the effort? How can I justify the effort against a tight budget or a tight timeline? How can I make a case for it when the other decision makers don’t even have it on their radar?
Tracking Print Pages
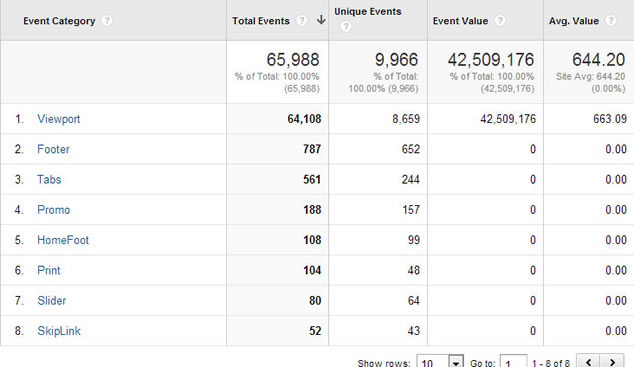
So I set about creating a dead-simple technique to track when print styles are called using Google Analytics. I already used Google Analytics’ event tracking feature to track what links on my home page are clicked, whether in my footer, in different content areas or in the carousel that graces the bulk of the home page. All I needed was to extend this same process to track print styles.
The solution was to record this request in Google Analytics via use of a page specific tracking GIF to be loaded loaded only when print styles are applied to the page (note the fake query string):
@media print {
  header::after {
    content: url(http://www.google-analytics.com/__utm.gif?[keep reading...]);  }
}
I create a query string server-side (avoiding additional load on the user’s browser) that includes the current page address, and let Google do the rest (you can get details on all the parameters from Google’s support site). Embed this CSS code in each page via a style block in the document head and you are all set. Since the tracking image isn’t called unless the print styles are called, and the print styles are called only when the user tries to print the page (a print preview will do it too), I don’t get any false positives.
In this code example, you can see the query string appended to the tracking GIF (please note, this is broken onto multiple lines for readability, so please make sure the url value is all on one line in your code):
@media print {
  header::after {
    content: url(http://www.google-analytics.com/__utm.gif?
    utmac=UA-XXXXXXX-X&
    utmwv=4.3&
    utmn=2013326124551&
    utmhn=algonquinstudios.com&
    utmr=-&
    utmp=/Engage/Careers&
    utmt=event&
    utme=5%28Print*/Engage/Careers%29&
    utmcc=__utma%3D267504222.1477743002.1364314722.1364314722
    .1364314722.1%3B%2B
    __utmb%3D267504222.17.7.1364314901604%3B%2B
    __utmz%3D267504222.1364314722.1.1.utmcsr%3D%28direct%29
    |utmccn%3D%28direct%29|utmcmd%3D%28none%29);
  }
}
Note that you have to ensure the correct encoding of parentheses in the event parameter:
utme=5%28Print*/Engage/Careers%29not
utme=5(Print*/Engage/Careers)Without encoding, parentheses would signal the end of the image’s URL in the CSS.
The nice part about this approach is that you don’t have to embed a “print me!” button on your page as the hook for the event tracking. This also means no matter how a user chooses to print the page, if that user action calls the print styles then it will be logged.
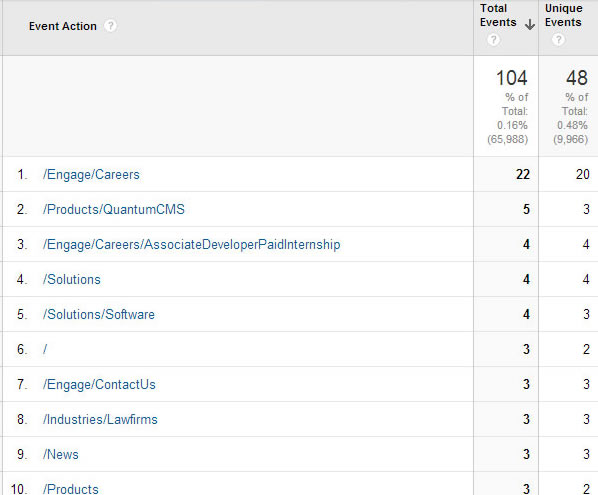
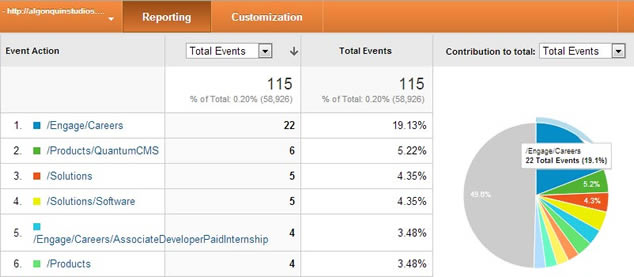
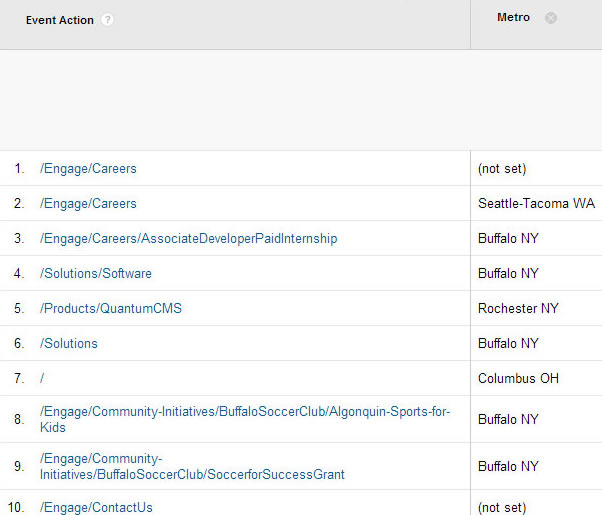
Once those events are logged in Google Analytics, I can then cross-reference them to geographic area, browser, platform and so on. With that, I have hard data, not just anecdotal evidence, whether or not users are printing pages, as well as which pages are printed and how frequently.
What Tracking Can Reveal
Despite what I’ve cautioned about assumptions, we make them and they may even be a needed part of the planning process. Accompanied by good data, though, these assumptions can be better informed. For users who choose to print a page, for example, I assume they are probably more invested in the content than the average site visitor.
Perhaps the user needs printed driving directions, or the user likes a chart of some sort enough to want to hang it on his or her cube wall. Either way, this user is choosing to print a page, grab it from the printer and then do something with it. Even though I may not know what the reasoning was, I can comfortably assume it was valuable to that user.
Since implementing tracking on my site, however, I have hard data to help inform these assumptions. It also helped me identify which pages were getting the most use and then work to make sure the printing experience was as good as possible. Instead of a shotgun approach to tweaking my print styles, I could now focus on the places where effort is needed most.
For example, the most common type of content printed from my site is job postings. These are potential future employees. This is my first opportunity to show these potential employees that the user is important, something that will be a part of any new employee training process. I want my site to demonstrate that we practice what we preach.
Another commonly-printed range of content is anything related to our products and services. Some quick cross-referencing within Google Analytics can show me if these are printed by one user. This can be an indication that the user is doing some research. Sometimes we can make an educated guess that one batch of printing jobs corresponds to a particular prospect, helping us understand what content interests him or her now.
I’ve also found that the contact page, with its map, street address and driving directions, strongly correlates to scheduled meetings. This makes it easy to ask in a meeting if the directions to my office were adequate or could be improved, building on our customer service focus.
While much of this tracking can be accomplished with third-party tracking bugs on your site paired with CRM platforms, my approach is effectively free. It builds on tracking you likely already have on your site, tracking that is ubiquitous and less likely to be blocked by privacy-minded users.
By Contrast, Carousels …
The ever-present carousel is criticized as being an over-wrought and over-used part of far too many web sites. I don’t want to pile on, but do want to help provide context for the effort we make building one feature over another when we don’t have data to justify those efforts.
Building the carousel feature on my own site took hours. Researching options, testing features, wading through code, experimenting with my CMS implementation, making it responsive, adding Google Analytics event tracking, and then, integrating it into our CMS so that it would match the design and allow our authors to maintain it without technical skill.
Overall I spent maybe 40 hours for this one feature.
When I look at click-through numbers on the links in my carousel, the numbers nearly match the numbers of pages printed from my site. Yet I only spent about an hour tweaking pre-existing print styles. Had I coded them from scratch, it might have taken me 4 hours on the high end.
What this tells me is that I spent about ten times as much effort building a feature that gets used as much as another casually-ignored feature, which I believe has a greater overall impact for a user’s experience on my site. If I am a decision maker with this data, along with the assumptions presented by a skilled developer, I am doing the project a disservice if I don’t treat print styles as at least equal to the carousel.
Find Ways to Track
As you evaluate features for a site, research if any of the tools you are considering have built-in tracking methods. If not, then ask for them. For example, I recently had a great conversation with the developer of a popular carousel, and he added Google Analytics event tracking to his feature list for the next release. Even if you can’t find a tool that has it built in, try to figure out how you can track it. As I demonstrated with tracking printed pages, it’s not impossible.
Don’t limit your tracking. While I focused on print styles and carousels here, there are many other site features that should be measure to help evaluate the return on investment. Track site features you’re asked to build, but you aren’t sure where they should fall in priorities or how much time should be invested in them. Give yourself and your team the ability to make decisions based on real data, not just bias.
The minimal effort you put into measuring can have a much larger pay-off down the road. You’ll be better positioned to put effort in the right places, freeing yourself from supporting features that don’t provide any value for you or your users.
Going the Extra Mile
While this article focused primarily on tracking existing content and working to improve it, you can use a similar technique for some very simple A/B testing.
If you struggle with the right language in a call-to-action, or perhaps the more compelling image from a set, or even placement of elements on a page, then measure each variation to see which gives you better results. Implementing this can be as simple as adding onclick="_gaq.push(['_trackEvent', 'LinkText', 'Text String 1']);" to a hyperlink (assuming you are using Google Analytics ga.js script).
In this example, “LinkText” corresponds to the overall thing you want to track (such as the call to action on a link) and “Text String 1” corresponds to a specific value you want to track (such as the words in the link). While proper A/B testing relies on the selection between the two options being random, if you cannot do that then give each variation some equal time (by day of week and time of day, perhaps) on the site and see which one has the better numbers.
This is by no means a perfect way to measure, but in the absence of any measurements of any kind, this can at least get you pointed in a direction.
Pitfalls to Avoid
- Make sure you aren’t tracking your own testing. If you are clicking every feature, showing off your site, or know your team is using it outside of any IP range you block, factor that into your evaluation.
- Be careful of false negatives. If the experience you built is so bad, the feature may get no use. You have to evaluate whether it’s a bad experience no one wants to repeat, or it’s truly useless.
- Not every feature needs to be tracked, especially if Google Analytics is already doing it. For example, you probably don’t need to add tracking to links in your navigation as Analytics can already measure that.
Things to Do
- Test regularly. If a feature doesn’t show much use via tracking, but you see it as valuable, check it regularly to make sure it’s still tracking. Sometimes a simple code modification can break your tracking.
- Name your events so they will be unique over time. Repeated values can make event tracking useless. For print tracking, use the URL of the page being printed. For carousels, find another technique since the value of the href attribute can be used anywhere.
- If you update a plug-in, add-on, or chunk of code to add event tracking, share it! Try to get it included in the original source. Make sure everyone has a chance to benefit from it, even if they choose to exclude it.
Further Reading
- “Tracking When Users Print Pages”, Adrian Roselli, 26 March 2013
- “Carousel Interaction Stats”, WeedyGarden, 22 January 2013
- “Turning off responsive web design”, Bruce Lawson, 12 January 2013
- “Printing The Web”, drublic, 25 March 2013
- CSS Paged Media Module Level 3, W3C, 2013
What features are you current measuring on your sites? What are some others you could track to make more informed decisions?
Discussion
, Jonthan Platts said:
said:
, Jeff Bridgforth said:
said:
, Moritz Profitlich said:
said:
, Adrian Roselli said:
said:
Share Your Thoughts
Please Log in or Sign up to share your thoughts.